Property value distribution
If you want to know how certain property values are distributed over a certain number of commercial products, you can call the corresponding function via the button [Property values distribution] 1 of the main view.
In this case, another window 2 will be opened.
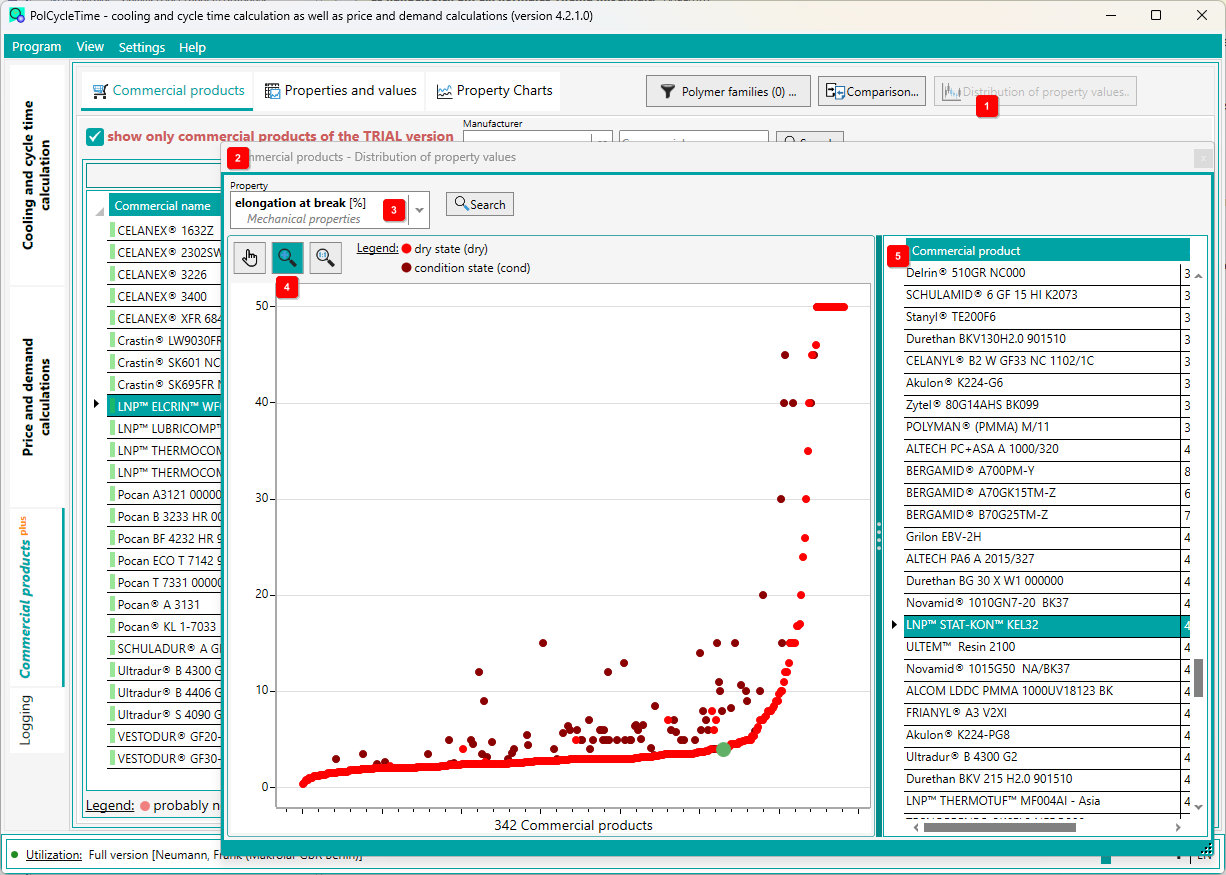
Select the property from the selection box 3 and then click the [Search] button. The distribution of the values is now displayed graphically. The values are displayed in ascending order (from left to right).
In addition to the display as a graphic, the property values are also displayed in a list 5 .
With this function, too, you can influence the set of values by filtering according to the polymer family.
To enlarge sections of the graphical display, draw a corresponding rectangle with the mouse (keep the left mouse button pressed and move the mouse accordingly and then release it).
By means of the button 4 above the graphic, the graphic can be moved, enlarged (as described before) and restored as a complete view.
If you select a material in the right list, the material will be highlighted by a green dot in the graphic. By double-clicking in the list, the material is also selected in the main view of the commercial products.