Show dependency diagrams
We have provided so-called dependency diagrams for certain inputs/decisions.
You can display these diagrams by assigning a geometry and one of the following properties accordingly.
- Flowability
- Flow resistance of the tool contours
- Melt temperature
- Tool contour materials
- Contour temperature
- Manufacturing precision
In each of the corresponding views there is a corresponding diagram symbol
- select the geometry by clicking on the diagram icon of the geometry
- select the property within the input groups (also by clicking on the diagram icon). Now another window will be opened.
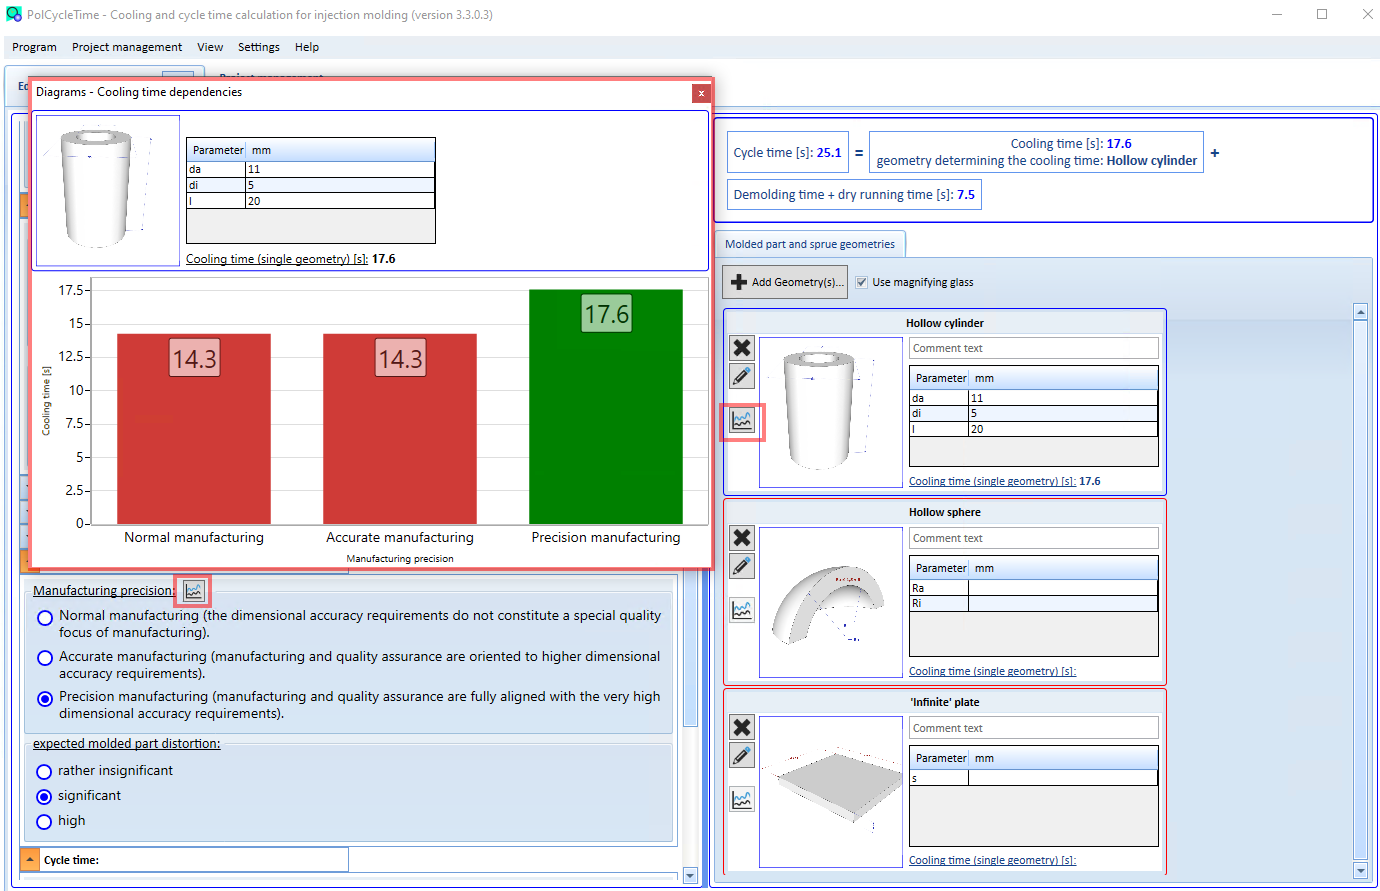
- here you can see the geometry and the possible values of the corresponding property (X-axis). Depending on this, the calculated cooling times are displayed as a bar chart or as a line chart.
- you can leave the window open and select either another property or another geometry. The display will then be updated accordingly.
- the value displayed in green corresponds to your current selection of the corresponding property
Here in this example you can see that with a required precision production the cooling time would increase by approx. 7 seconds.