Results
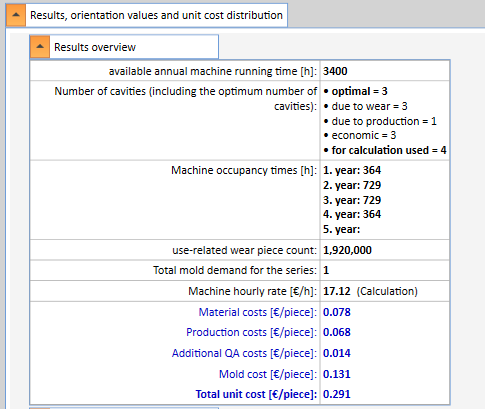
As soon as the first inputs/decisions lead to the fact that results or orientation values can be calculated, these are displayed among other things in the result overview.
The results are shown as:
- Results overview
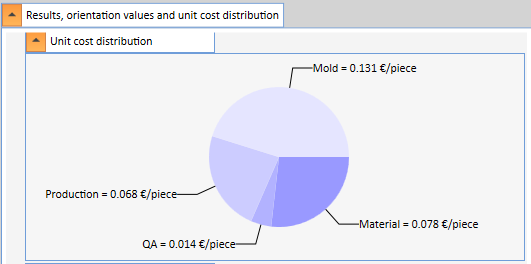
- Piece cost distribution
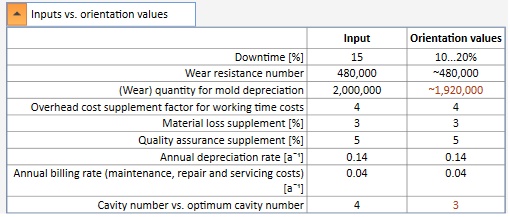
- Inputs vs. orientation values
grouped. The groups can be displayed and hidden individually by clicking in the text of the group.
In the Inputs vs. Orientation Values view, entries are highlighted in red if they differ from your inputs.